
Get a quote
Logistics Solutions
Book
Track & Trace
Tell us what you need
Would you like to know more about our logistics solutions?
Book your next shipment directly

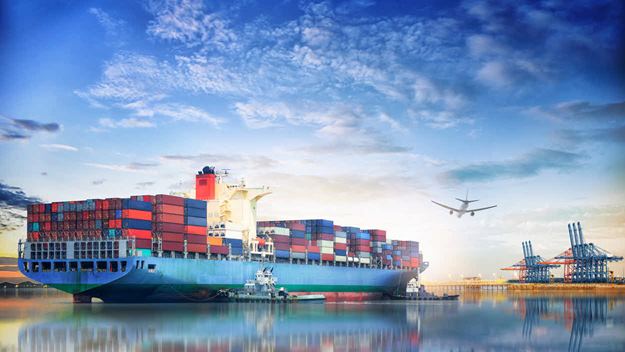
Whatever your industry, we are your global freight forwarder
-
Automotive
Transportation and logistics services to optimise supply chains and meet tighter production schedules. -
Technology
End-to-end, integrated and reliable supply chain solutions to link production sites with distribution channels across the world. -
Healthcare
Dedicated teams and a wide range of solutions to ensure compliance with quality standards and regulations. -
Industrial
Tailor-made solutions to manage complex demands and make supply chains leaner and more agile. -
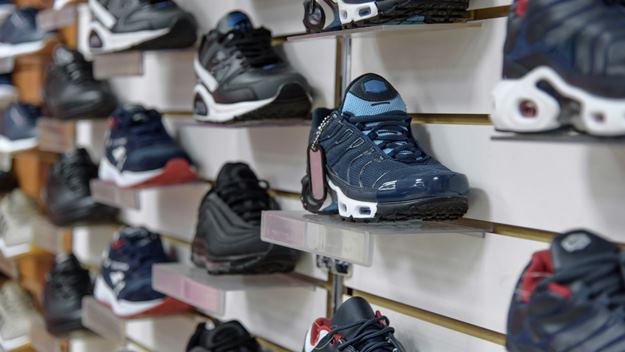
Consumer
Transport to warehouse, distribution centre or direct-to-store so goods can reach the retailers directly.
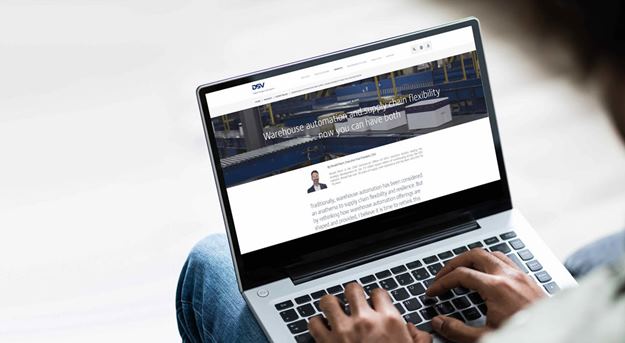
Self service
Manage your shipments
Latest news

DSV Q1 results: strong start to 2024 with gains in market share
DSV had a strong start to 2024 with gains in market share across all divisions. The Q1 results are in line with expectations and reflect the normalisation of freight markets.
DSV announces changes to the Executive Board and the Group Executive Committee
In line with its long-term succession planning, DSV has made changes to the Executive Board and the Group Executive Committee. These appointments will strengthen the company's change capacity and support its commercial approach, while ensuring continuity across all operations.

DSV reports solid results for 2023
Operating in an environment with softening demand and normalising freight markets, DSV delivered solid results for 2023. Gross profit decreased by 13.4%, while EBIT before special items was down by 27.4% compared to 2022. These results were in line with expectations after the extraordinary results of 2022.
What our customers say
DSV proved to us that they are willing and able to provide manpower for our needs - which is something vitally important for us. They also respond flexibly when it comes to the unusually rapid growth of our business.
Frank van Overbeek, Under Armour
Learn about transport and logistics


DSV in numbers
1,600+
Offices and logistic facilities
80+
Countries worldwide
75,000~
Employees
Any questions?
Our experts are ready to help. Get in touch and we'll find the solution you need.